UCDF was designed as the software description method independent of the computer languages. It turns out that it can describe any system from any view. As such, UCDF is capable of description of code on the lowest level of operators and expressions, down to assembly, and that is why it can be called "software schematics", through the mid-level of functions, classes, and modules to the higher level of packages, systems, general interactions, communications, and architecture. It is capable, staying within the same set of abbreviations, to describe technical details, functional particularities and behavior, and even cause-effect dependencies.
Types of proposed diagrams do not differ from each other by method or abbreviations, but only by what is reflected and in what geometrical shape. They are emphasizing various aspects of a software system. Any of these diagram types can be aligned with any other, and refer another like low-level with high-level, or a functional with technical, providing a unique opportunity of reviewing parts of the system within the system, and the system as the whole from every perspective. It works as a lens. No more information scattered around departments, files, folders, notebooks, tabletops, and brains - everything is together and connected, in one documentation system.
 |
Low level code diagrams are diagramming chunks of code on the operator level, small functions. It is hardly usable for every piece of code since the code itself is more compact, but it can be useful for some intricate algorithms which use a multitude of variables since we can show their related type structure and affecting functions.
Low level diagrams are more useful to show how two chunks of code interoperate. |
| |
Code Functional diagrams, pseudocode. |
 |
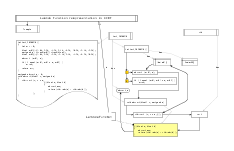
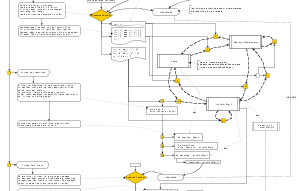
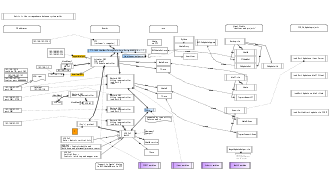
Information flow diagram through function calls. It shows all related data affecting the flow and their types (classes). This flow can go through multiple threads, modules, scripts, and computers. It may include intermediate variables and database tables. It shows both control and data flows and may have three shapes: control flow specific, dataholder specific, and data flow specific (information content specific).
A typical example, when a click from a controlling computer goes into network through all function calls and is received by a SoC board, passes through all its code, and ends up in a robot. |
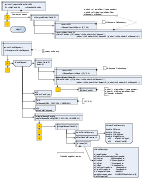 |
Data Structure diagram shows a complex data structure, types (classes) of its numerous members, what creates and destroys them, what fills them, where the members are used, and sample data (information content of data holders) to get an important feeling what the content actually is. This is also a combined control and data flow diagram, but its emphasis is on the data structure which is shown to the detail, but other things are shown on the higher level of system hierarchy. Note that, as life shows, the information structure contained in the data holders may not match the dataholders structure, but it is possible to show both with UCDF. |
| |
"Debugging Snapshot" diagram. This is any diagram with actual data values and passed control flows obtained during operation or a debugging session.
It is very useful in problem analysis. |
 |
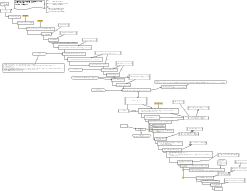
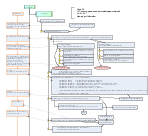
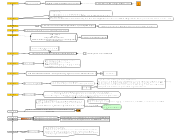
A Library diagram. A class diagram and an interface diagram are library diagrams as well. Libraries, classes, interfaces are all called a module in UCDF. A library diagram lists all the variables and functions in the module, their arguments, how they are inter-related and call each other. What makes this diagram indispensable is that it shows the order how the library members can be used, their lifecycle as well as the higher level or even functional one of the code behind. Without many words we see what is connected, what is not, what are the relations, and how it works. |
 |
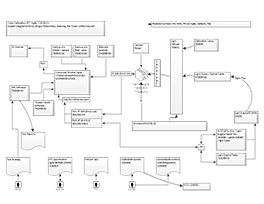
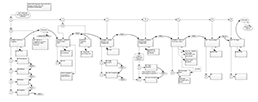
State-Machine diagram. UCDF state-machine diagram shows all the code which changes states, as well as what these states mean in the code: how control and data flows are changed altogether with the code structure. No guessing, everything is shown explicitly. |
| |
Timing diagrams of state machines. It is a re-order of the State-Machine diagram with the emphasis on the order lines. It is useful when there are several state-machines operating. A familiar timing diagram is within. |
| |
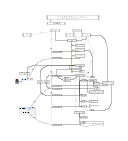
Threading diagram. It shows threads and processes of the software package with all variety of synchronization mechanisms including message passing. It is similar to the sequence type of UML diagrams, only with precise details and more flexibility. |
 |
Functional diagram alongside with high-level technical software schematics. Functions, not software functions(), but descriptions what is happening behind the technical details are often related not to a single code block, but to a number of them and some data, and related control and data flows. Putting and aligning two types of diagrams together saves a lot of words in the description. |
| |
Combined UCDF-Flowchart diagram or UCDF-UML diagram. UCDF as description of actual code is placed on the same diagram as familiar flowchart or UML diagrams with the association lines between corresponding elements thus obtaining mapping between implementation and design. |
 |
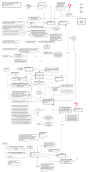
System diagram. A typical system could be an installation controlled by a computer or computers, and including actuators, motors, sensors, network, cameras, and flows of material and energy, plus related documentation. UCDF can reflect vividly all aspects of it related to information flow and software development process. |
 |
Software Project diagram. Software project includes many components: requirements, major exe-s and dll-s, third party executables, files, instructions, and their documentation, all the projects for code preparation and building, data preparation software, databases, scripts, documentation, directories where all this is located, verification procedures, people involved, functional diagrams, source control, meeting notes, daily activities, customers, etc, etc, etc. May be a project lead knows it all, and does not need it, but how much time and effort he spends conveying his knowledge to an employee? How about two employees? Three?
Software Project diagram contains it all. Once and for long time. |
 |
"Matrix". A special kind of diagram found to be useful. It alignes essential reference to four components: major software modules, projects building them, boards and systems running them, and networking, mostly IP addresses, connecting them. One can add documentation references.
If a new contractor walks in to a company, this is the place he can start right away:
1) Where is the source code? 2) What different systems exist? 3) Where are they located? 4) How do they interact? 5) Where are all the passwords I need? 6). Etc.. |
| |
Build process diagram. Build process can be very complicated involving multiple scripts and a lot of information from all sides. It may build many targets. Overall it is a pretty unpleasant process with many small details. Diagramming that can be very useful. |
 |
Production Line diagram. Not only goods move along a production line. Information may move along from station to station coded, for example, inside a chip on the product. It should be put into overall information structure. |
 |
"Day-to-Day" diagram as a diary can be personal, or group-wide. The main order line is representing a timeline with direct links to web-pages, code, files, and projects with some important notes about their structure-related issues. All in UCDF. You can click on a box, and your shell window pops up and a script gets executed, or a file explorer starts, or your favorite word processor, or a website.
It can reflect the progress of the group and a project in its completeness. This is the place to keep ideas and decisions which may not take place in the final design. |
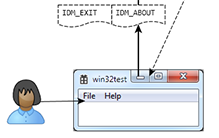 |
Operation manual. It is an instruction which involves mostly GUI and a keyboard, but sometimes other more complicated things like manual calibration. Everything is nicely reflected and may be connected to actual modules and code. |
| |
Installation guide. Not everything can be done automatically by an installer and a lot of components of an operating system may be involved like setting IP addresses, wiring devices, etc. |
| |
IT instructions for a new employee. When a new employee comes to his working place, many things have to be set up and conveyed to him. The structure of a software department and its informational resources can be quite complex. Do not explain it anew to everyone. Make a diagram or order one here. |